

New Orleans recorded 25 pedalcyclist deaths in NHTSA’s fatal-crash files for 2020–2024. Twelve occurred during 2022–2024, the period used for the main city comparison in this study. Across those three years, New Orleans’ rate was 1.09 deaths per 100,000 resident-years.
The three-year comparison starts in 2022 for a specific reason: NHTSA then began counting motorized bicycles within its pedalcyclist category. Combining earlier and later counts without noting that change can mislead readers. The five-year counts appear below, while the city comparison uses the consistent 2022–2024 period.
This is a Babcock Injury Lawyers analysis of NHTSA FARS public downloads and Census Vintage 2025 city population estimates. It compares a named set of 13 Southern cities. It does not establish a national ranking or measure the risk of an individual bicycle trip.
The New Orleans annual record
Scroll horizontally to see all columns. Use the arrow keys when the table is focused.
| Year | Recorded pedalcyclist deaths | Resident population estimate | Deaths per 100,000 residents |
|---|---|---|---|
| 2020 | 6 | 383,361 | 1.57 |
| 2021 | 7 | 377,506 | 1.85 |
| 2022 | 4 | 371,038 | 1.08 |
| 2023 | 7 | 365,782 | 1.91 |
| 2024 | 1 | 363,477 | 0.28 |
The data show substantial year-to-year variation: six deaths in 2020, seven in 2021, four in 2022, seven in 2023, and one in 2024. All 25 selected New Orleans records were classified as bicyclists, rather than other pedalcyclists. Each occurred in a separate crash. The federal records identify the same 25 deaths for New Orleans and Orleans Parish.
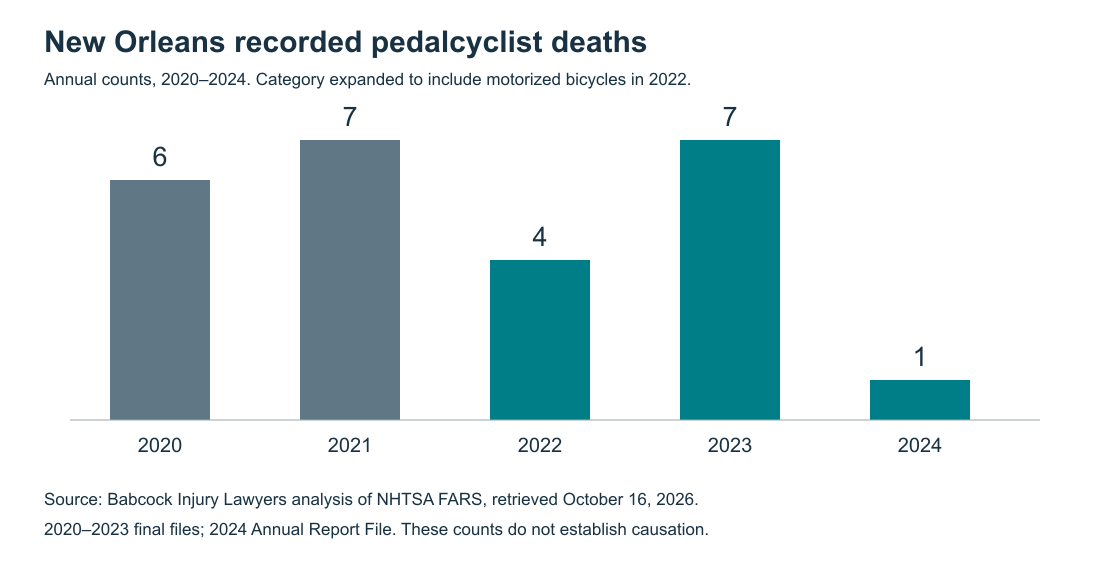
The one recorded death in 2024 is encouraging as a count, but it cannot establish a durable change in safety or explain what caused the change. It is a small number, and the 2024 Annual Report File may be revised. A multi-year view reduces dependence on one year’s result without solving every measurement problem.
How New Orleans compares within this group
Scroll horizontally to see all columns. Use the arrow keys when the table is focused.
| City | Deaths, 2022–2024 | Population person-years | Deaths per 100,000 resident-years |
|---|---|---|---|
| Atlanta, Georgia | 3 | 1,534,494 | 0.20 |
| Austin, Texas | 9 | 2,967,075 | 0.30 |
| Baton Rouge, Louisiana | 7 | 664,727 | 1.05 |
| Birmingham, Alabama | 2 | 590,762 | 0.34 |
| Dallas, Texas | 10 | 3,953,608 | 0.25 |
| Houston, Texas | 36 | 7,048,034 | 0.51 |
| Lafayette, Louisiana | 4 | 366,444 | 1.09 |
| Memphis, Tennessee | 4 | 1,848,757 | 0.22 |
| Mobile, Alabama | 2 | 606,498 | 0.33 |
| New Orleans, Louisiana | 12 | 1,100,297 | 1.09 |
| San Antonio, Texas | 22 | 4,515,573 | 0.49 |
| Shreveport, Louisiana | 1 | 535,446 | 0.19 |
| Tampa, Florida | 17 | 1,225,438 | 1.39 |
New Orleans’ 1.09 rate is close to Lafayette’s 1.09 and Baton Rouge’s 1.05 after rounding. Tampa’s rate is 1.39 in this group. These small differences and small counts should not be turned into a confident league table of trip-level danger. Houston recorded more deaths than New Orleans, but its larger population produces a lower population-based rate.
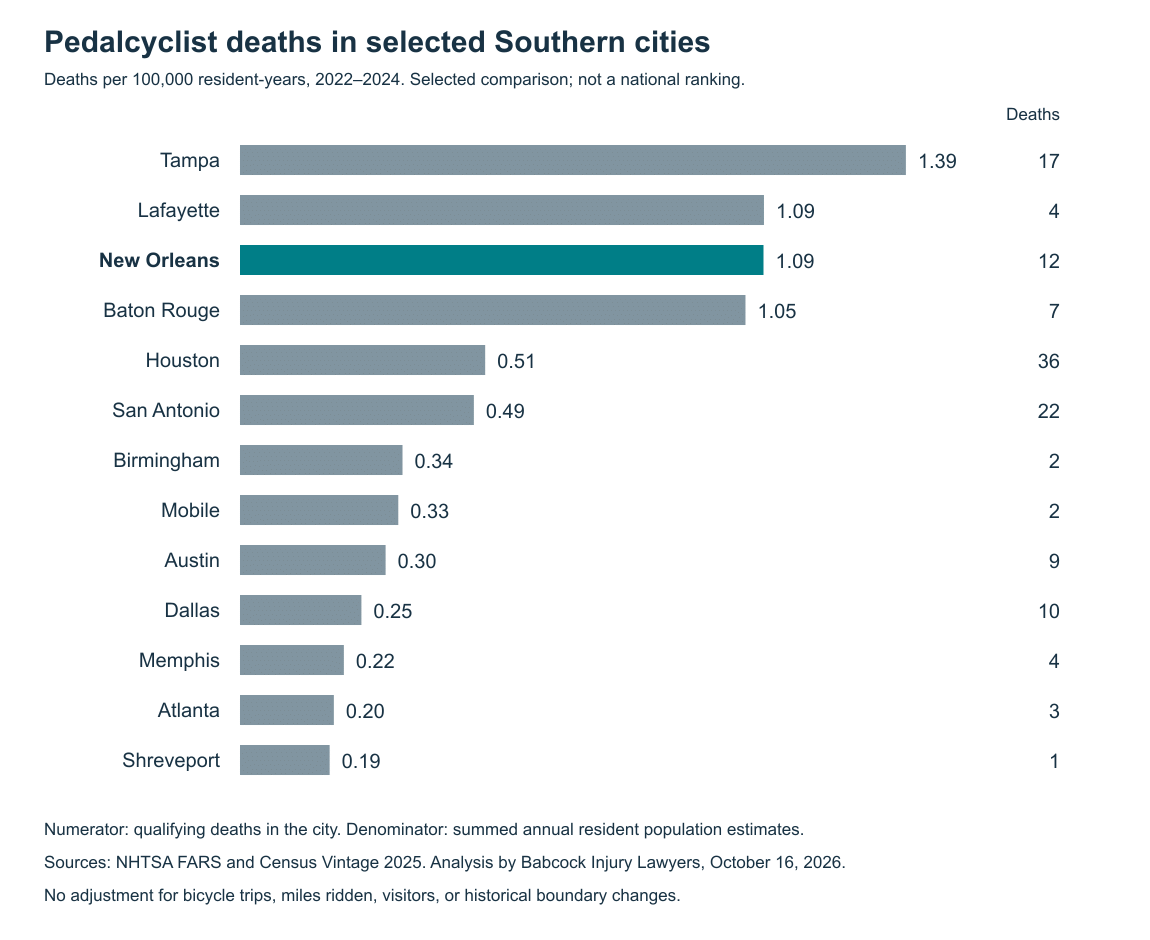
The comparison group was specified before calculating its rates: New Orleans, Baton Rouge, Lafayette, Shreveport, Houston, Dallas, Austin, San Antonio, Atlanta, Memphis, Tampa, Mobile, and Birmingham. It combines Louisiana cities with selected regional cities for context. These cities provide regional context. They were not selected as a representative national sample or because their street networks are equivalent.
What the rate actually measures
For New Orleans in 2022–2024, the three annual population estimates total 1,100,297 resident-years. Dividing 12 deaths by that population total and multiplying by 100,000 gives 1.0906, rounded to 1.09. Every city’s rate uses the same period and formula. It is a population-weighted annual rate, not the three-year death count divided by a single year’s population.
The numerator counts people killed in qualifying crashes located in the city, whether or not they lived there. The denominator is the city’s resident population. Visitors, commuting patterns, bicycle use, route choice, and mileage are not measured. A higher rate can reflect more cycling exposure as well as other conditions; this calculation cannot separate those effects.
One additional death would change New Orleans’ three-year rate by about 0.09 per 100,000 resident-years. That sensitivity is a reason to publish the counts and denominators alongside rounded rates rather than presenting an unexplained rank.
How this updates the earlier New Orleans discussion
Verite’s June 2023 reporting discussed a 2017–2021 League of American Bicyclists analysis and the human consequences of local crashes. This study supplies later records and an inspectable calculation. It does not reproduce that earlier study’s city universe or establish that its historical ranking remains true today.
The earlier report and this comparison use different years, definitions, population estimates and city groups. The figures therefore cannot establish that New Orleans moved up or down in a national safety ranking.
Sources, geography, and quality checks
The counts include bicyclist and other pedalcyclist deaths in qualifying FARS crashes, assigned to cities according to the location recorded by NHTSA. Death and crash records are matched by year and case. The downloadable data identify the federal crash records and the corresponding Census population records.
Population values come from the Census Vintage 2025 subcounty file, incorporated-place summary level 162. All population estimates for 2020–2024 come from that same release. FARS city classifications and Census population geographies are administrative definitions; this study does not independently harmonize historical annexations or boundary changes. Records with unreported city codes are not allocated to a city by assumption.
Duplicate records are excluded. The national pedalcyclist totals agree with Table 1 of NHTSA’s 2024 bicyclist fact sheet. For 2024, the selected-city counts for Houston, Dallas, San Antonio, Austin, Memphis, and Atlanta can also be checked against that report’s Table 7. Population-based rates can differ from an older publication when Census estimates are revised.
FARS covers qualifying motor-vehicle traffic crashes resulting in death within 30 days. It does not measure all nonfatal bicycle injuries or every cycling death outside its scope. The 2020–2023 source files are final files; 2024 is the Annual Report File. NHTSA’s 2024 bicyclist fact sheet explains both the 2022 definition change and the status of the annual files.
Download the city-year data, New Orleans fatality records, source URLs, and method. The workbook includes the five annual records as supplementary historical information; the main comparison uses 2022–2024.
What still requires local evidence
The counts do not identify the cause of a particular collision or establish the effect of a bike-lane project, policing change, or driver’s conduct. Those questions require additional evidence and an appropriate study design.
Our accident evidence guide discusses preservation of the underlying proof. The New Orleans bicycle accident practice addresses individual claims. A citywide statistic supplies context; video, witnesses, road conditions, and the crash reconstruction determine what happened in a specific case.
Research date: October 16, 2026. Independent analysis by Babcock Injury Lawyers; not an official NHTSA or Census publication.
Related Louisiana guidance. Our Lafayette Parish pedestrian and bicycle crash map offers a closer look at individual recorded crash locations. For questions about the vehicle itself, see our Louisiana e-bike classification guide. Browse the full Louisiana Legal Research collection for additional topics.