


Editorial & Legal Accuracy Notice (Louisiana)
This blog contains general legal and safety information and is not legal advice. Laws and deadlines can change, and outcomes depend on specific facts.
Last reviewed / updated: March, 2026
Reviewed, updated, and authored by: Stephen Babcock, Louisiana injury lawyer
This page explains what common fatal-crash statistics measure and why the numbers vary. It also gives a practical evidence and insurance checklist for Louisiana car accidents.
When a statistic scares you, the best next step is to translate it into something practical: risk factors, documentation, and decisions you control. We are not built for volume. We are built for leverage. Speed + evidence preservation + insurer-insider knowledge + trial-ready preparation = The Babcock Benefit. In a serious Louisiana crash, leverage often starts with preserving the proof that explains why the crash was deadly or nearly deadly.
People search “what are the chances of dying in a car accident” because they want a clear number. The problem is that each source measures risk differently, and your real-world risk depends on speed, impairment, restraints, road design, and what happens in the first seconds of impact. Below, we break down the most common metrics and show how to protect your legal position if you were hurt in Louisiana.
If you are inside the first 72 hours, call (225) 500-5000 or use the free case review form before evidence changes.
Firm links: Client Reviews | Contact | Locations
Want a print-friendly version of the checklists and both infographics? Download the printable toolkit (PDF) and keep it with your claim paperwork.
What Are the Chances of Dying in a Car Accident in Louisiana?
A National Highway Traffic Safety Administration early estimate shows the U.S. still loses tens of thousands of people each year in traffic crashes, so the risk is not theoretical. The National Safety Council’s odds-of-dying data translates those totals into lifetime odds across the population, which helps with perspective but cannot predict what will happen to one specific driver.
| Risk Metric | What It Tells You | Best Use |
|---|---|---|
| Annual crash deaths | How many people died on U.S. roads in a year | Trend awareness and policy context |
| Deaths per 100 million miles | A rate that adjusts for how much Americans drive | Comparing years when total miles change |
| Lifetime odds | A population-based estimate of risk over a lifetime | Personal perspective, not legal proof |
| State-to-state variation | How much fatality rates differ by location and conditions | Understanding why Louisiana risk can look different |
State numbers can be higher or lower than national averages, and the spread can be large. When you read about the chances of dying in a car accident, always check whether the source is talking about miles, people, or lifetime odds. The IIHS state-by-state fatality facts show how much death rates vary by state, which is one reason a Louisiana driver’s “chances” can look different from the national figure. If you were hurt in Baton Rouge or nearby, our Baton Rouge car accident practice page explains the claim process and what evidence usually matters.
How Is Fatal-Crash Risk Measured?
Most “chance of dying” statistics use one of three denominators: miles traveled, population, or lifetime exposure. A CDC transportation safety overview explains why a single year’s death count does not tell the full story without context like travel volume, behavior trends, and vehicle safety changes.
- Per mile: Best for comparing years, because total driving changes with the economy and travel patterns.
- Per person: Best for comparing places, because it relates deaths to population.
- Per trip: Harder to measure, because trip data is less consistent across sources.
- Lifetime odds: Best for perspective, but it blends together many types of drivers and conditions.
That is what we mean by leverage: you do not argue with a scary headline number, you build a record that explains the crash mechanics and the human impact in your case. When the file is organized early, it is harder for an insurer to minimize what happened.
What Factors Increase Fatal Crash Risk?
The biggest predictors of fatal outcomes are speed, impairment, restraints, and roadway conditions. A NHTSA speeding overview notes that speed both increases crash risk and makes injuries more severe when a crash happens.
- Speed and impact type: High closing speeds, head-on impacts, and side impacts raise fatal risk.
- Alcohol or drug impairment: A NHTSA drunk-driving overview tracks how impairment contributes to deadly crashes.
- Seat belt use: A CDC seat belt fact sheet describes how seat belts cut the risk of death and serious injury for front-seat occupants.
- Night driving and rural roads: Reduced visibility and higher travel speeds can reduce reaction time and increase severity.
- Distraction and workload: If distraction played a role, we also cover documentation tips on our distracted driving page.
What Should I Do After a Serious Car Accident?
Focus on safety first, then build a clean record of what happened before details fade. The best early goal is to preserve the evidence you already have and identify what else exists, because you rarely get a second chance to capture the scene.
- Get medical help and follow-up care: A CDC transportation safety overview highlights how common crash injuries are, and consistent care creates clear records.
- Secure the basics: crash report number, tow/storage location, and insurer claim numbers.
- Preserve digital proof: back up photos and videos, and keep originals unedited.
- Be careful with early insurance calls: ask what they want and when, and do not guess about facts you do not know.
This is why we push early evidence preservation: once a vehicle is repaired or sold, and once scene conditions change, the easiest proof can disappear. If you want a roadmap for your next steps, start with our Louisiana car wreck claim guidance and then narrow the plan to your facts.
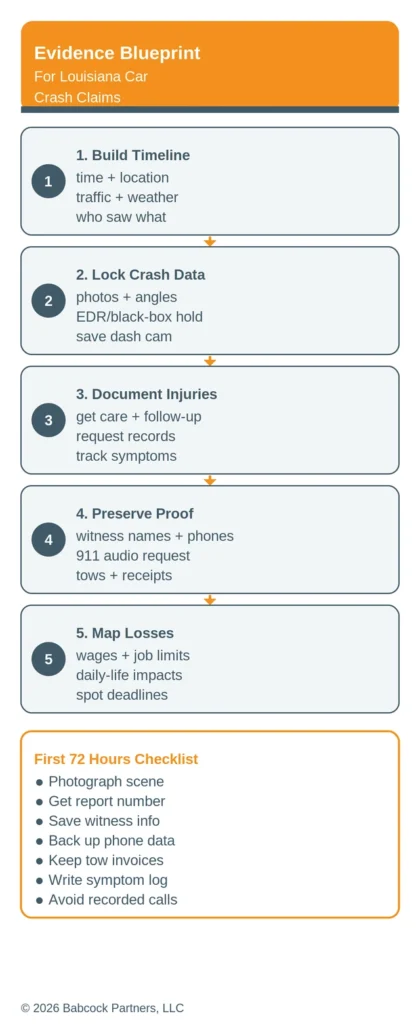
Timeline Builder: The First 72 Hours
The first three days after a crash are when evidence is easiest to capture and hardest to recreate later. Your goal is not to “prove everything” in 72 hours, but to stop preventable proof gaps from opening.
- Hour 0–6: Take wide and close photos, gather witness info, and note the time, weather, and lighting.
- Hour 6–24: Get checked out, write down symptoms, and request the crash report number.
- Day 2: Confirm where the vehicle is stored and preserve any dash cam or phone video.
- Day 3: Start a simple expenses folder and save every insurer email, text, and letter.
- Talk to a lawyer quickly if a death occurred, a commercial vehicle was involved, or an insurer is pushing for a fast recorded statement.
- Talk to a lawyer quickly if you suspect a road defect, missing signage, or a dangerous intersection design contributed to the crash.
- Talk to a lawyer quickly if the vehicle is at risk of being repaired, totaled, or released before key photos and data are preserved.
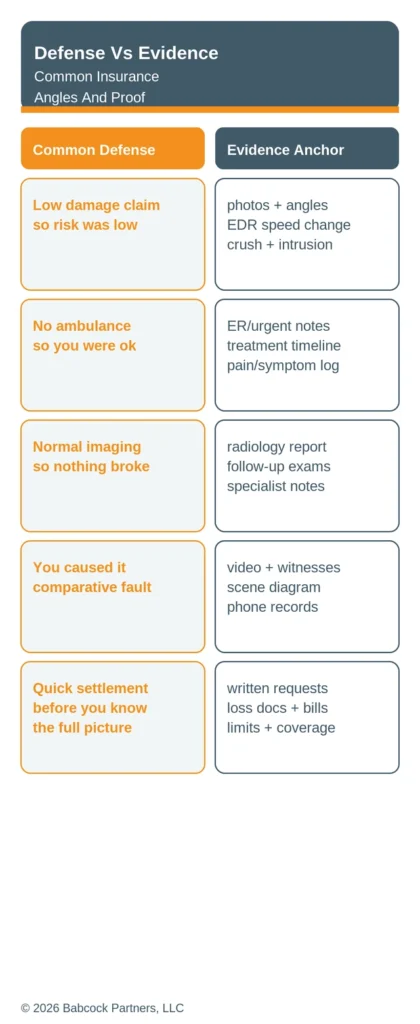
Defense Audit: How Insurers Argue About Risk
Insurance companies rarely fight statistics head-on; they fight your story and your documentation. The goal of a defense audit is to predict the “why this was not that serious” narrative early, then build evidence anchors that shut it down.
- “The damage looks minor.” Counter with photos from multiple angles, repair records, and objective data where available.
- “You did not go by ambulance.” Counter with a clean treatment timeline and a symptom and function log.
- “You must have been partly at fault.” Counter with witness names, scene measurements, and consistent statements.
- “You are fine now.” Counter with work limits, daily-activity impacts, and follow-up documentation.
That is what we mean by leverage: we match each defense angle to a specific record, so the file answers questions before an adjuster can weaponize uncertainty. If alcohol impairment is involved, our drunk driving practice page covers the evidence issues that often show up.
What we see in practice
In serious Louisiana crash cases, we usually see the same pressure points: evidence disappears, records get scattered, and early insurer narratives harden. We also see that families who build a timeline and keep a clean paper trail make it easier to prove what changed in their lives.
- Scene proof goes missing: photos get lost, witnesses move on, and roadway conditions change.
- Medical records do not tell the whole story: without a symptom and function log, insurers call limitations “subjective.”
- Adjusters push speed: quick settlement pressure often arrives before the full picture is clear.
- Comparative fault becomes a lever: small inconsistencies can get framed as major responsibility.
This is why we organize the file around proof gaps instead of slogans. When you can point to a record for each disputed issue, negotiation becomes less about opinion and more about evidence.
How a Lawyer Uses Risk Data Without Overpromising
Statistics can frame why a crash type is dangerous, but they do not prove fault or damages by themselves. A Louisiana traffic records summary report shows that the state tracks mileage-based fatality rates and related indicators, which helps explain why crash prevention is a constant statewide focus.
- We use stats for context: to explain why speed, impairment, and restraint use matter.
- We use evidence for proof: crash reports, photos, witnesses, and medical and work records drive liability and damages.
- We keep the claim Louisiana-specific: local road layouts, local responders, and local venue rules change how a case develops.
If a crash in Baton Rouge caused a death, our fatal car accident page explains the next legal questions families often face. If you are still gathering basic facts, the Baton Rouge hub can help you find the right starting point.
Want the checklists in one place before you talk to an adjuster? Download the printable toolkit (PDF) and use it to track your timeline, records, and insurer contacts.
Louisiana Law Snapshot (Updated 2026)
Louisiana deadlines and fault rules can change what a claim is worth and whether a claim survives. The safest move is to treat the earliest date as the real deadline and to preserve evidence before anyone can reshape the story.
| Rule | Plain-English Meaning |
|---|---|
| Two-year delictual prescription | La. Civ. Code art. 3493.1 sets a two-year deadline for most injury claims, and the clock usually starts on the day the injury or damage is sustained. |
| Comparative fault with a 51% bar | La. Civ. Code art. 2323 explains how fault is allocated, and the current text bars recovery when the injured person is 51% or more at fault. |
Free Case Review for Serious Crashes
We are not built for volume. We are built for leverage. Call (225) 500-5000 and use the free case review form so we can protect evidence, spot deadlines, and apply the Babcock Benefit approach to your facts. If you want a quick overview first, read our Baton Rouge car accident case page and then come back to the checklist below.
These items are helpful to have with you when you call, but do not delay calling because you do not have them. If you have them handy, keep them nearby for the call.
- Crash report number and the agency that responded
- Photos/videos of vehicles, scene, and visible injuries
- Names and phone numbers for witnesses
- Tow/storage location and repair estimates
- Insurance policy and claim numbers (if assigned)
Call Today If…
- A death occurred or you are handling matters for a family member
- The other driver may have been impaired, distracted, or speeding
- A commercial vehicle, rideshare, or delivery vehicle was involved
- You are being pushed to give a recorded statement or sign a release
- The vehicle may be repaired, totaled, or sold before key evidence is preserved
What Happens Next
- Evidence triage: We identify what proof exists and what must be preserved immediately.
- Deadline spotting: We map the dates that control your options under Louisiana law.
- Insurer contact strategy: We help you avoid early statements that can limit the claim later.